About
Mission, Vision, and Values
Simpson University is a Christ-centered learning community committed to developing each student in mind, faith, and character for a lifetime of meaningful work and service in a constantly changing world. Read more about our mission, vision, and values.
The Simpson University Story
Simpson University, California’s only Christian university north of Sacramento, has been educating and shaping world-influencers for nearly 100 years. Fully accredited, Simpson offers 25+ liberal arts and professional studies degrees, a degree completion program, graduate studies, and credential programs, serving more than 1,000 students a year.


Our Institutional Identity
History
As the 1926 catalog stated: “Seattle is several hundred miles nearer to China than any other trade routes across the Pacific…if this is the gateway through which the blessed gospel must reach millions yet in darkness, it is an ideal place to train and equip those who shall carry it to these needy souls…”
By 1940, Simpson was offering a choice of programs: Theology, Missiology and Bible/Music. By 1945, it had officially become the western regional school of the C&MA.
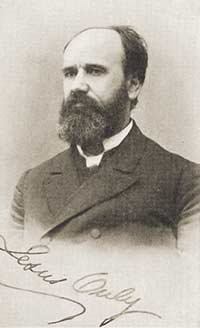
Simpson University was founded in 1921 as Simpson Bible Institute by W.W. Newberry, who served as its first president. Established in Seattle, Washington, the school was named in honor of Albert Benjamin Simpson (1843-1919), a Presbyterian minister who pioneered the Bible institute movement during the late nineteenth century and founded the Christian and Missionary Alliance. Initially offering a two-year program of study, the school was designed to promote spiritual growth and prepare students for Christian life and service, especially overseas.
In 1955, the school moved to San Francisco, and its name was changed to Simpson Bible College since it was now granting bachelor’s degrees. Over the years, the college continued to broaden its academic offerings so that by the time the half-century mark was reached in 1971, it had become a more comprehensive liberal arts college offering professional as well as biblical studies. That same year, the name was changed to Simpson College.
Another historic milestone was passed in 1989 when Simpson relocated to its current location in Redding and began building a new campus, which is still a work in progress. Since the move, undergraduate enrollment has grown from less than 200 to more than 1,200. Graduate programs (including the School of Education and A.W. Tozer Theological Seminary) have been established, and the Adult Studies (ASPIRE) program was added. In 2004, Simpson College became Simpson University.
Today, Simpson students represent a range of Christian denominations. Typically, the largest segment are members of The Christian and Missionary Alliance; the remainder are associated with more than 30 different denominations and several independent churches. They represent a mix of ethnic backgrounds, and they come from a number of states and foreign countries.
The faculty, as well, reflect a broad range of evangelical backgrounds. Educated at a cross-section of institutions across the nation, they are also experienced in international study and ministry.
Since the early 1950s, the logo-statement of the college has been “Gateway to World Service.” Although our original mission has expanded since 1921 and alumni of today serve in a variety of ministerial and lay professions, Simpson University maintains its focus on global service and its passion to deliver the gospel of Christ to those still lost in darkness.
Statement of Faith
There is one God,(1) who is infinitely perfect,(2) existing eternally in three persons: Father, Son, and Holy Spirit.(3)
Jesus Christ is the true God and the true man.(4) He was conceived by the Holy Spirit and born of the virgin Mary.(5) He died upon the cross, the Just for the unjust,(6) as a substitutionary sacrifice,(7) and all who believe in Him are justified on the ground of His shed blood.(8) He arose from the dead according to the Scriptures.(9) He is now at the right hand of Majesty on high as our great High Priest.(10) He will come again to establish His kingdom, righteousness and peace.(11)
The Holy Spirit is a divine person,(12) sent to indwell, guide, teach, empower the believer,(13) and convince the world of sin, of righteousness, and of judgment.(14)
The Old and New Testaments, inerrant as originally given, were verbally inspired by God and are a complete revelation of His will for the salvation of men. They constitute the divine and only rule of Christian faith and practice.(15)
Man was originally created in the image and likeness of God:(16) he fell through disobedience, incurring thereby both physical and spiritual death. All men are born with a sinful nature,(17) are separated from the life of God, and can be saved only through the atoning work of the Lord Jesus Christ.(18) The portion of the impenitent and unbelieving is existence forever in conscious torment;(19) and that of the believer, in everlasting joy and bliss.(20)
Salvation has been provided through Jesus Christ for all men; and those who repent and believe in Him are born again of the Holy Spirit, receive the gift of eternal life, and become the children of God.(21)
It is the will of God that each believer should be filled with the Holy Spirit and be sanctified wholly,(22) being separated from sin and the world and fully dedicated to the will of God, thereby receiving power for holy living and effective service.(23) This is both a crisis and a progressive experience wrought in the life of the believer subsequent to conversion.(24)
Provision is made in the redemptive work of the Lord Jesus Christ for the healing of the mortal body.(25) Prayer for the sick and anointing with oil are taught in the Scriptures and are privileges for the Church in this present age.(26)
The Church consists of all those who believe on the Lord Jesus Christ, are redeemed through His blood, and are born again of the Holy Spirit. Christ is the Head of the Body, the Church, (27) which has been commissioned by Him to go into all the world as a witness, preaching the gospel to all nations.(28) The local church is a body of believers in Christ who are joined together for the worship of God, for edification through the Word of God, for prayer, fellowship, the proclamation of the gospel, and observance of the ordinances of Baptism and the Lord’s Supper.(29)
There shall be a bodily resurrection of the just and of the unjust; for the former, a resurrection unto life;(30) for the latter, a resurrection unto judgment.(31)
The second coming of the Lord Jesus Christ is imminent(32) and will be personal, visible, and premillennial.(33) This is the believer’s blessed hope and is a vital truth which is an incentive to holy living and faithful service.(34)
[1] Deuteronomy 6:4, [2] Matthew 5:48, [3] Matthew 28:19, [4] Philippians 2:6–11, [5] Luke 1:34–38, [6] 1 Peter 3:18, [7] Hebrews 2:9, [8] Romans 5:9, [9] Acts 2:23–24, [10] Hebrews 8:1, [11] Matthew 26:64, [12] John 14:15–18, [13] John 16:13; Acts 1:8, [14] John 16:7–11, [15] 2 Peter 1:20–21; 2 Timothy 3:15–16, [16] Genesis 1:27, [17] Romans 3:23, [18] 1 Corinthians15:20–23, [19] Revelation 21:8, [20] Revelation 21:1–4, [21] Titus 3:4–7, [22] 1 Thessalonians 5:23, [23] Acts 1:8, [24] Romans 6:1–14, [25] Matthew 8:16–17, [26] James 5:13–16, [27] Ephesians 1:22–23, [28] Matthew 28:19–20, [29] Acts 2:41–47, [30] 1 Corinthians 15:20–23, [31] John 5:28–29, [32] Hebrews 10:37, [33] Luke 21:27, [34] Titus 2:11–14
Diversity Statement
Simpson University, as a Christ-centered learning community, values each person as a unique and gifted child of God, made in His image and called to live as Jesus lived.
SU, following the example of Christ, is committed to working to establish the Kingdom of God for every tongue, tribe, people and nation. All are called by Him to participate together in a grace-filled community. In valuing diversity, SU encourages each individual to develop his or her own unique gifts, talents, and strengths that will enrich the Simpson community through dialogue, celebration, and peacemaking leading to restored relationships.
SU strives to create a culture of common understanding where diversity is valued. Through the perspectives of each race, sex, ethnicity, culture, socioeconomic status, class, age, and ability, SU is intentionally committed to building an environment that is welcoming and honoring of all where learning is maximized through understanding and acceptance to create excellence in education.
For these reasons, SU commits to do the following:
- celebrate the richness of God’s kingdom and those created in the Imago Dei.
- learn from one another in humility.
- honor people and practice grace.
- build an international and multicultural community through recruitment, education, and collaboration.
- raise our collective awareness of injustice and inequities through education.
- address systemic injustice and inequities through education and institutional leadership.
- create a community where people experience a sense of belonging and are recognized and appreciated for their contributions.
- create a constructive environment where multiple perspectives can be heard.
- model Christ in all of our interactions.
SU does not discriminate on the basis of race, color, national origin, ethnic group identification, sex, age or physical or mental disability. However, as a private religious institution, the University reserves the right to exercise preference on the basis of religion in all of its employment practices and student admissions.
Accreditation
Simpson University has been accredited by the Western Association of Schools and Colleges (WASC) Senior College and University Commission (WSCUC) since 1969.
As a member, the university participates in periodic accreditation review. By participating in this process Simpson University demonstrates its commitment to developing and sustaining institutional capacity (operational integrity, fiscal stability and appropriate organizational structures to fulfill its purposes) and its commitment to educational effectiveness (organizing for learning and being a learning organization).
Simpson’s accreditation status and supporting documentation can be found on WSCUC’s official site.
Other Accreditations and Memberships
View all the university’s accreditation, approval and membership information on Simpson’s Accreditation and Memberships page.
University Profile
| Incoming Students Fall 2022 | |
| First-Time Freshman | 110 |
| Average High School GPA | 3.31 |
| Transfer | 90 |
| Average Transfer GPA | 3.05 *of 82 |
| Applied | 1405 |
| Admitted | 823 |
All Students Fall 2022 | |
| Total | 874 |
| Men | 341 |
| Women | 533 |
| California Native | 688 |
| U.S. States Represented | 27 |
| International | 81 |
| Student Diversity | 46% |
| Undergraduate including Non-Degree | 645 |
| Traditional Undergraduate excluding Non-Degree | 546 |
| Degree Completion | 97 |
| Graduate | 229 |
Success Rates | |
| Acceptance Rate Fall 2022 | 59% |
| Retention Rate Fall 2021 – Fall 2022 | 65% |
| Return Rate Fall 2021 – Fall 2022 | 79% |
| Graduation Rate Fall 2016 – Fall 2022 | 47% |
| Faculty Fall 2022 | |
| Total Faculty | 106 |
| Full-Time | 37 |
| Part-Time | 69 |
| Student to Faculty Ratio | 13:1 |
| Staff Fall 2022 | |
| Total Staff | 113 |
| Full-Time | 90 |
| Part-Time | 23 |
| Degrees Awarded 2021-2022 | |
| Bachelor’s | 211 |
| Master’s | 27 |
Data may vary from IPEDS reporting due to differences in IPEDS defined reporting categories and institutional defined reporting categories. For more detailed student demographic information, view our Institutional Research Page.